Hypsometric Map- a map that uses a systematic application of colors to represent relief.
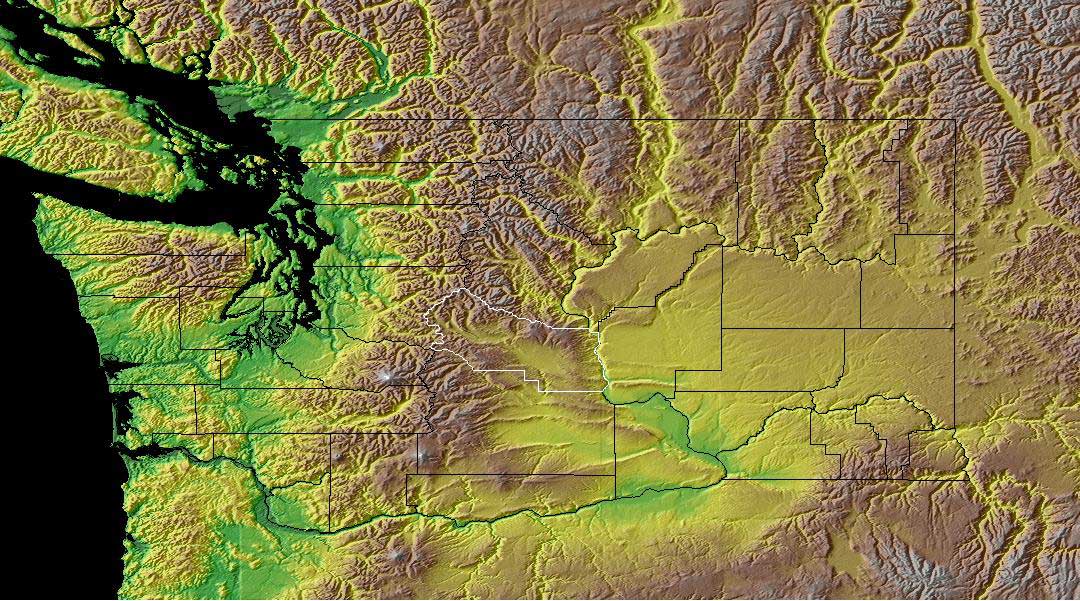
On a hypsometric map each color represents an amount of elevation above or below a baseline. Some hypsometric maps include the contour lines of elevation, while others omit them. Some maps, like the one above, use shading so that there is not a distinct break between each color and the elevation is conveyed in a more fluid manner. Generally, green represents the lowest elevation, then up to yellow and tan and brown, with white at the top. This map shows a hypsometric color scheme for an area of Washington state.
No comments:
Post a Comment