Parallel Coordinate Plot- a graph that displays data in several dimensions. Each variable is graphed on a vertical axis and each data element is plotted as a connected set of points, one on each axis.
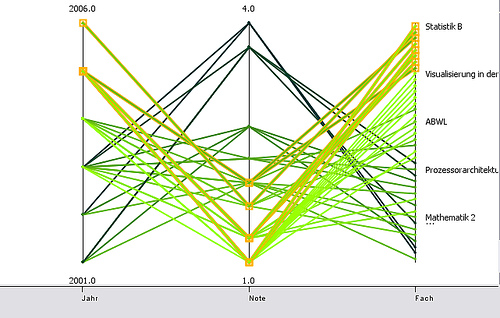
This parallel coordinate plot shows grades received by the author at the University of Konstanz between 2001-2006. The first vertical line is the year variable, with each point being a separate year. The next vertical line is the grade variable, with points represented from 1 to 4. The last vertical line is the subject variable.
No comments:
Post a Comment