Sunday, April 17, 2011

Cartographic Animation

Cartographic Animation- a map that incorporates animation to show a change in some dimension, commonly a change over time. 


This map reflects trends in population from 1910-2000. Each point of light equals 10,000 people, and from the map it is easy to see how the major urban centers grew and when. Other maps that are in conjunction with this one show the black population as a percentage of the total population, and the differences between where blacks settled versus where the total population settled. Maps like this one make it easy to convey a lot of data in one map, instead of having to make ten separate maps and then read them in order. 

PLSS Map

PLSS Map- a map used by the Public Land Survey System to survey and identify land parcels. It is divided into townships and ranges. 


A PLSS map is used to identify land parcels throughout the US. The map is created using a principal meridian and a base line, along which townships and ranges are mapped. Each state has at least one base line and one principal meridian, although some have multiples, especially if they are far from a rectangular shape. The map above shows all the townships in Alabama, and the ones that are highlighted are the Franklin county townships. 

Thursday, April 14, 2011

Triangular Plot

Triangular Plot- a two-dimensional map in which three variables are mapped. The ratios of the three variables are plotted as positions within an equilateral triangle. 


A triangular plot can depict interactions with variables in different positions or how the different variables relate to each other. In the above diagram, the variables are the fields listed along the outside of the triangle and the data points are the specific sciences listed within the triangle. Chemistry is very much a disciplinary science and an earth system science, but not at all a decision making field. Politics is very much a decision making field, but not at all a disciplinary science or an earth system science. Engineering is squarely in the middle of the disciplinary sciences, earth system sciences, intergration, interpretation, and decision making. 

Isotach

Isotach- a contour line that joins points of equal or constant wind speed. 


Isotachs are another kind of isoline. Isotachs can be mapped in the upper or lower atmosphere. They can be used to analyze wind flow and can be important in weather predictions. This map also includes wind barbs to show the direction that the winds are flowing in. 

Hypsometric Map

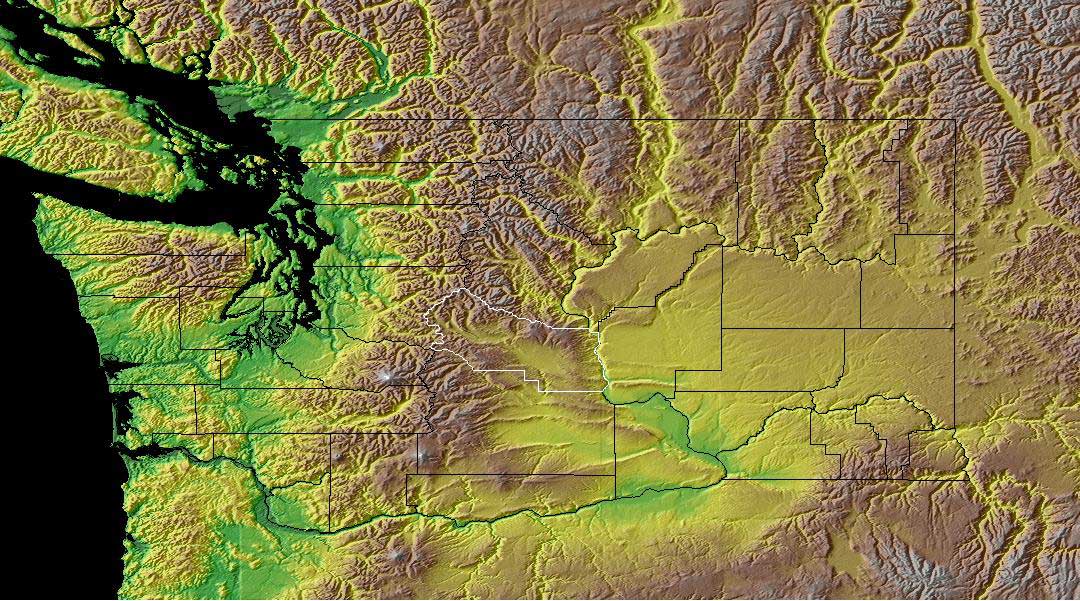
Hypsometric Map- a map that uses a systematic application of colors to represent relief. 


On a hypsometric map each color represents an amount of elevation above or below a baseline. Some hypsometric maps include the contour lines of elevation, while others omit them. Some maps, like the one above, use shading so that there is not a distinct break between each color and the elevation is conveyed in a more fluid manner. Generally, green represents the lowest elevation, then up to yellow and tan and brown, with white at the top. This map shows a hypsometric color scheme for an area of Washington state. 

Thematic Map

Thematic Map- any type of map or chart that is designed to show a spatial pattern of a theme or a series of attributes. A thematic map can show any kind of statistical information, as opposed to a topographic map. 


"Thematic Map" is a very broad category, which can include many more specific types of maps. They can have qualitative or quantitative data, display large or small areas, and show any number of topics or themes. The main qualifier of a thematic map is that it displays statistical data of some description, rather than physical features of a landscape. This map shows population change in the provinces of Canada between 1996 -2001. The amount of change is conveyed both with the color of the province and the height from the baseline of the map. 

Digital Elevation Model (DEM)

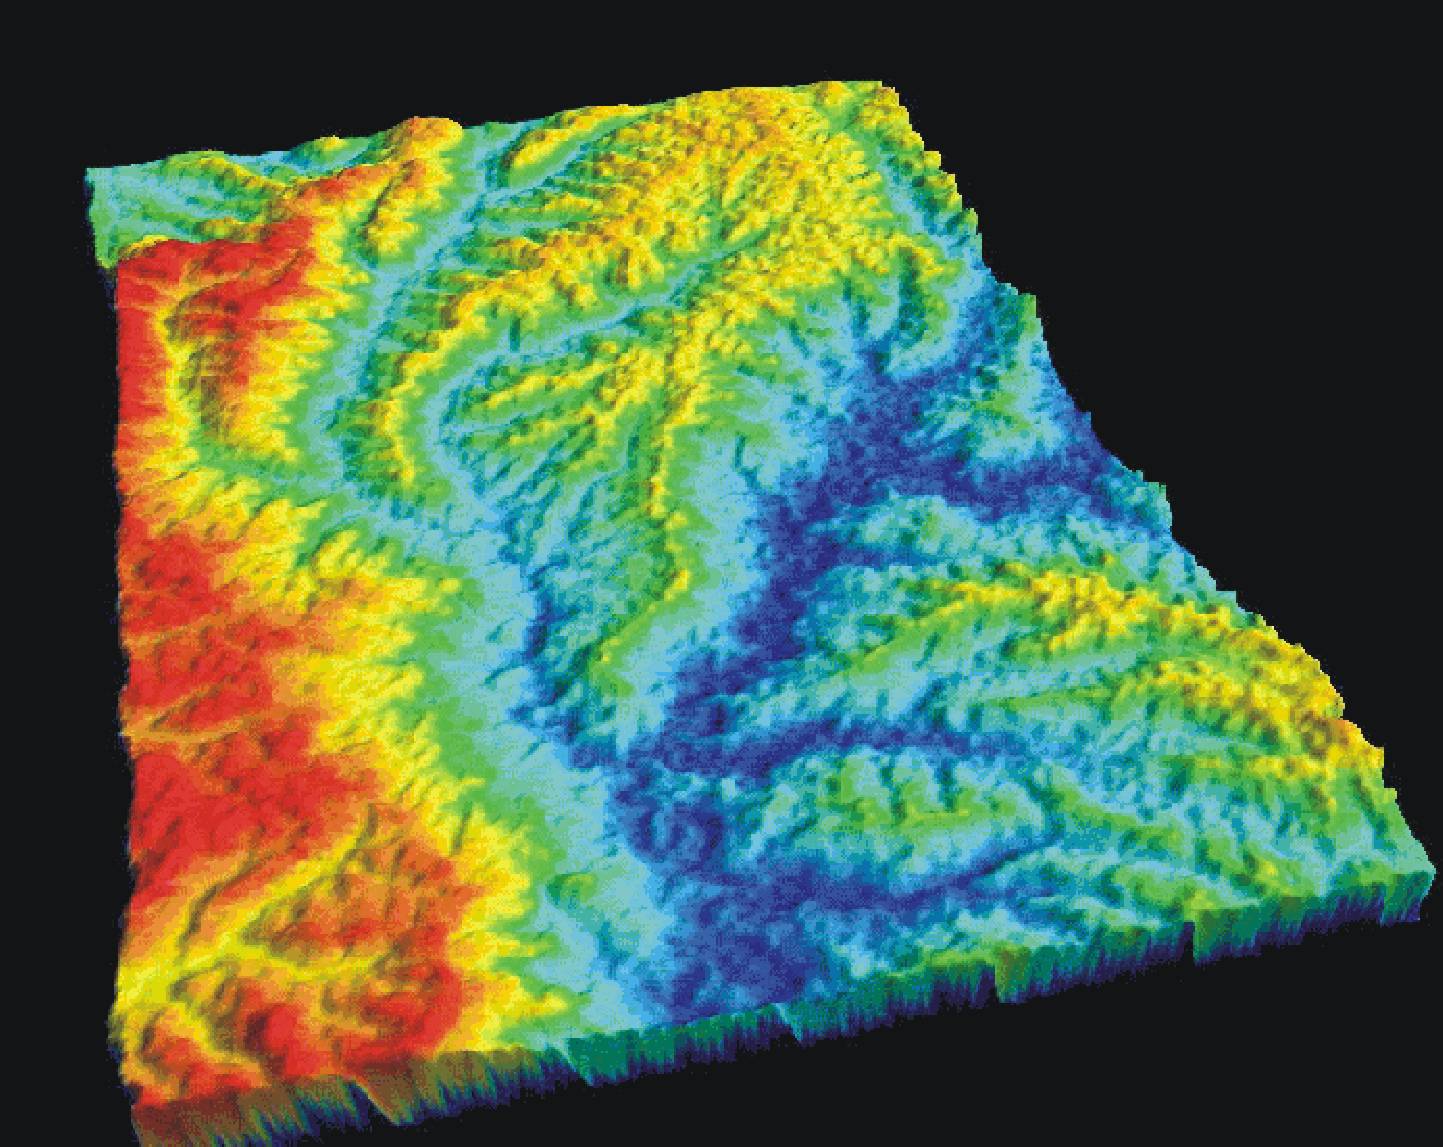
Digital Elevation Model- a digital model of elevation or altitude that can be represented by regularly or irregularly spaced point height values. 


A digital elevation model represents ground surface or topography. It is computer-created from data that are plotted on a map and then filled in to create a 3-dimensional map. Digital elevation models can be tilted and rotated to make each feature more accessible and to aid viewing of the overall area. This map is a digital elevation model of a part of Lesotho, in southern Africa. Red is the highest elevation and dark blue is the lowest.