Monday, April 18, 2011

Index Value Plot

Index Value Plot- a graph that shows the index value for each point, which is the ratio of the value to the total of all the values, instead of a concrete number. 


This index value plot shows the shift in ocean temperatures from 1900-2008. Orange values are above average temperatures, and blue values are lower than average temperatures. The article with this graph argues that changes in ocean temperatures are common and long-lasting, and that a rising ocean temperature is not necessarily related to intense climate change. 

Similarity Matrix

Similarity Matrix- a matrix of scores which represents the similarity between two data points. 


This is a similarity matrix for The Beatles' "Hey Jude". The deep blue parts represent repeating parts, and the lighter and more yellow parts represent dissimilar parts. The matrix is constructed by comparing the similarity of measures of music. 

Digital Line Graph

Digital Line Graph- a format used by the USGS to prepare a digital vector version of a topographic map. 


Digital line graphs can be downloaded for use from the USGS. They display the features from a topographic map in digital form. They are accompanied by a user guide, without which the features are hard to identify and access to their information is limited. This is a DLG of Beaufort, SC.

Star Plot

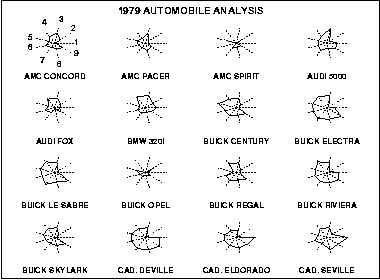
Star Plot- a method used to examine relative values for a single data point. 


A star plot has a sequence of spokes, with each spoke representing one variable. The data length of the spoke is proportionate to the magnitude of the variable. Star plots are often shown with multiple plots in one diagram, to compare observations. This diagram shows 16 star plots for different types of cars. The variables are: 1 price, 2 mileage (MPG), 3 1978 repair record (1= worst, 5= best), 4 1977 repair record (1= worst, 5= best), 5 headroom, 6 rear seat room, 7 trunk space, 8 weight, and 9 length.  

Isobar

Isobar- a line connecting points with the same atmospheric pressure at a given time or the same average over a given period. 


An isobar is another type of isoline. Isobars connect areas with equal pressure, and can help determine areas of high and low pressure. In the map above, the isobars indicate an area with rapidly changing pressure, which led to very high winds across the area. This map is from May 6, 1999, and the website it came from provides an analysis of why the high winds were created. 

DRG

DRG- digital raster graphic- a digital scan of a USGS topographic map. 


A digital raster graphic is a digital image of a scanned paper USGS topographic map. DRGs are used in GIS and mapping applications, and are useful as a backdrop for layering other digital data to check for accuracy. This map is a section of a DRG for Bushkill, PA. 

Weather Map

Weather Map- usually a satellite map with a variety of overlays on it. It will have isobars showing pressure, radar for showing precipitation or clouds, and colorful graphics to make the information easier to understand. 


Weather maps combine many different types of map into one finished product. This map has doppler radar, which shows the precipitation over different parts of the country. The key for intensity of precipitation is at the top. Isobars (the white lines) show areas of equal pressure, but don't really tell you how to read them. The graphic symbols for highs and lows show areas of pressure, and the blue line indicates a cold front. This map contains a lot of information but most of it probably doesn't make sense to the average viewer- only the precipitation is pretty intuitive.